| Python-based Hierarchical ENvironment for Integrated Xtallography |
| Documentation Home |
Generating publication content with phenix.table_oneThis program is experimental and still in development! Please report any problems to bugs@phenix-online.org. OverviewThe utility phenix.table_one is a tool for generating the standard table of crystallographic statistics required by most scientific journals. It combines the validation features of phenix.model_vs_data with the ability to calculate merging statistics and/or parse many data processing logfiles from programs such as SCALA or HKL2000. Multiple structures may be input, and a separate column will be generated for each one. The program is available both in the GUI and the command line; however, because the multiple-structure input makes the command line version more cumbersome to run, this document will generally reference the GUI version. A full list of parameters (with brief explanations) can be found below. ConfigurationEach structure has a separate tab for data input. The final model and data file including R-free flags are required; these should usually be the same files you will submit to the PDB. It is recommended that you provide any CIF (restraints) files for non-standard ligands present in the model; otherwise, eLBOW will be run to generate restraints for any unrecognized residues, but this is frequently less accurate when only the model is available. If you have multiple CIF files in a single directory you may specify the directory path instead of the individual files. 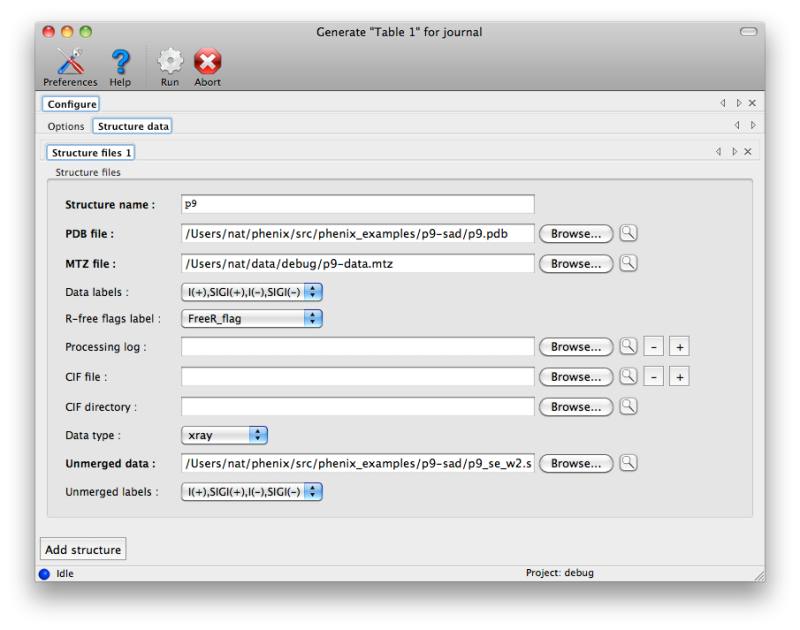 If you have the scaled-but-unmerged intensities (for instance, processed using the "no merge original index" macro in HKL2000/Scalepack), you can also enter these at the bottom of the panel. This will allow the program to re-calculate merging statistics such as the multiplicity/redundancy, R-sym, and R-meas. Alternately, any number of data processing logs may be supplied, but this will usually only be the logs for integration and scaling (the latter contains the most useful statistics). Currently MOSFLM, SCALA, XDS/XSCALE, and DENZO/SCALEPACK/HKL2000 log files should be parseable in most cases. If you do not supply either unmerged data or the processing logs, the fields relevant to this step will be left blank in the final document. Certain statistics which may not always be accurately represented in the log files, such as Mean(I/sigma), will always be calculated based on the input data. The program has relatively few other options beyond the structure inputs. Multiple processors may be utilized if you have input more than one dataset. The most important option is the choice of whether to use phenix.model_vs_data to calculate the final R-factors, or take the values reported in the PDB header. If the model was refined in phenix.refine and the full resolution range present in the data file was used, these should be nearly identical. For other programs such as REFMAC, there is typically a small margin of error (usually around one percent or less) due to implementation details. In addition, for structures with small twin fractions which did not use a twin target in refinement, phenix.model_vs_data may recalculate R-factors that are several percent lower. In these cases it is better to use the values reported in the header, to avoid discrepancy between the article and the PDB deposition. 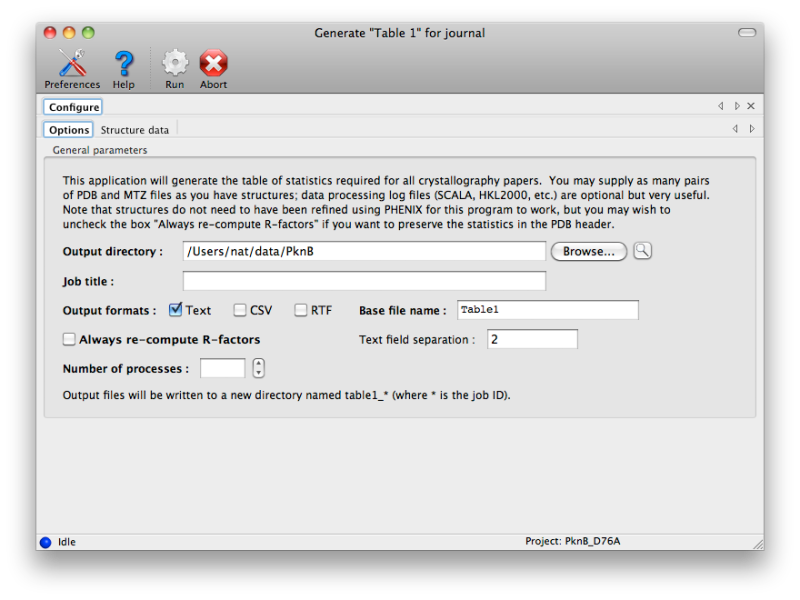 Output filesBy default the program outputs text and RTF formats in a new directory. The RTF file may be edited with Microsoft Word or most other word processing software, and/or copied into another document. Final appearance of a typical result is shown below; usually some editing is required to ensure proper formatting. For data-related statistics (including the R-factors), values for the highest-resolution 10% of reflections will be displayed in parentheses next to the overall value. 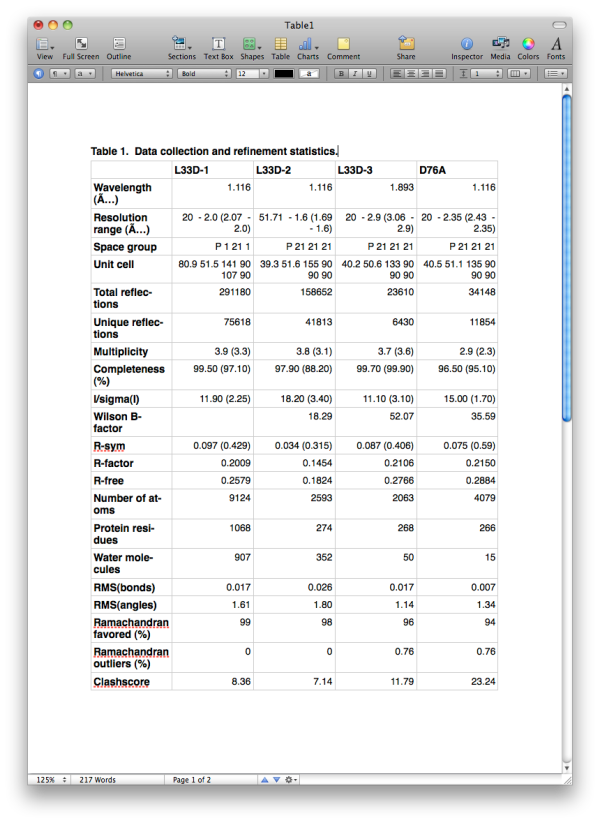 List of all table_one keywords
-------------------------------------------------------------------------------
Legend: black bold - scope names
        black - parameter names
        red - parameter values
        blue - parameter help
        blue bold - scope help
        Parameter values:
          * means selected parameter (where multiple choices are available)
          False is No
          True is Yes
          None means not provided, not predefined, or left up to the program
          "%3d" is a Python style formatting descriptor
-------------------------------------------------------------------------------
table_one
   structure
      name= None Structure name (will become column label)
      pdb_file= None PDB file
      mtz_file= None MTZ file
      data_labels= None
      log_file= None Processing log file (SCALA, Scalepack, XDS, etc.). You
                can specify multiple logs, but only the integration and
                scaling logs are used.
      cif_file= None Restraints file
      cif_directory= None Directory containing restraints - all CIF files
                     found will be used.
      data_type= *xray neutron
      unmerged_data= None Secondary reflections file with unmerged
                     intensities, for calculation of merging statistics.
      unmerged_labels= None
      r_free_flags
         label= None R-free flags label
   processing
      re_compute_r_factors= False
   multiprocessing
      nproc= 1
      technology= *multiprocessing sge lsf pbs condor
      qsub_command= None
   output
      directory= None This is only used by the PHENIX GUI.
      job_title= None
      show_missing_fields= True
      format= *txt csv *rtf
      base_name= Table1
      verbose= True
      text_field_separation= 2
| |